EEGLAB Home
May, 2011: Version 1.03
- What is CORRMAP?
- Requirements
- Download and Installation
- Tutorial
- FAQs
- Citing CORRMAP
- Licence
- References
- Acknowledgements
CORRMAP plug-in is a set of Matlab functions written by Filipa Campos Viola, which allow the identification and clustering of independent components (ICs) representing EEG artifacts. This tool is based on the correlation of ICA inverse weights and it finds independent components that are similar to an IC template defined by the user. CORRMAP is designed to work within the EEGLAB environment, providing a GUI to identify and cluster artifactual ICs across subjects. All functions can also be used from the Matlab command line, providing expert users with the ability to use them in custom scripts.
In addition to the requirements of EEGLAB, CORRMAP plug-in needs the Matlab Statistics Toolbox to work. It is also mandatory that you have run ICA for all datasets that you want to use. If bad channels were removed from datasets, their indices must be stored in EEG.badcomps. A STUDY set must be created using these datasets and a channel locations file must be provided. To learn more about these requirements please read FAQs.
1) Download the compressed CORRMAP plug-in file corrmap1.03.zip into your 'plugins' directory of your EEGLAB
distribution.
2) Uncompress the donwloaded file using utility software. Inside your 'plugins' directory, you should now have a directory called 'corrmap1.03' containing all the necessary m-files and binaries and a pdf with the reference paper. Starting EEGLAB should now automatically recognise and add the plug-in.
You should see the following line appear in your matlab environment window: That's it.
eeglab: adding "corrmap1.03" plug-in (see >> help eegplugin_corrmap)
This short tutorial will take you through using CORRMAP from the GUI. We will show you how to get started in four steps. We encourage you to try following these steps using your own data. We will also assume that you know the basics of EEGLAB e.g. loading a dataset, creating a study set, plotting, data structures, etc. If not, refer to the EEGLAB website for more information.
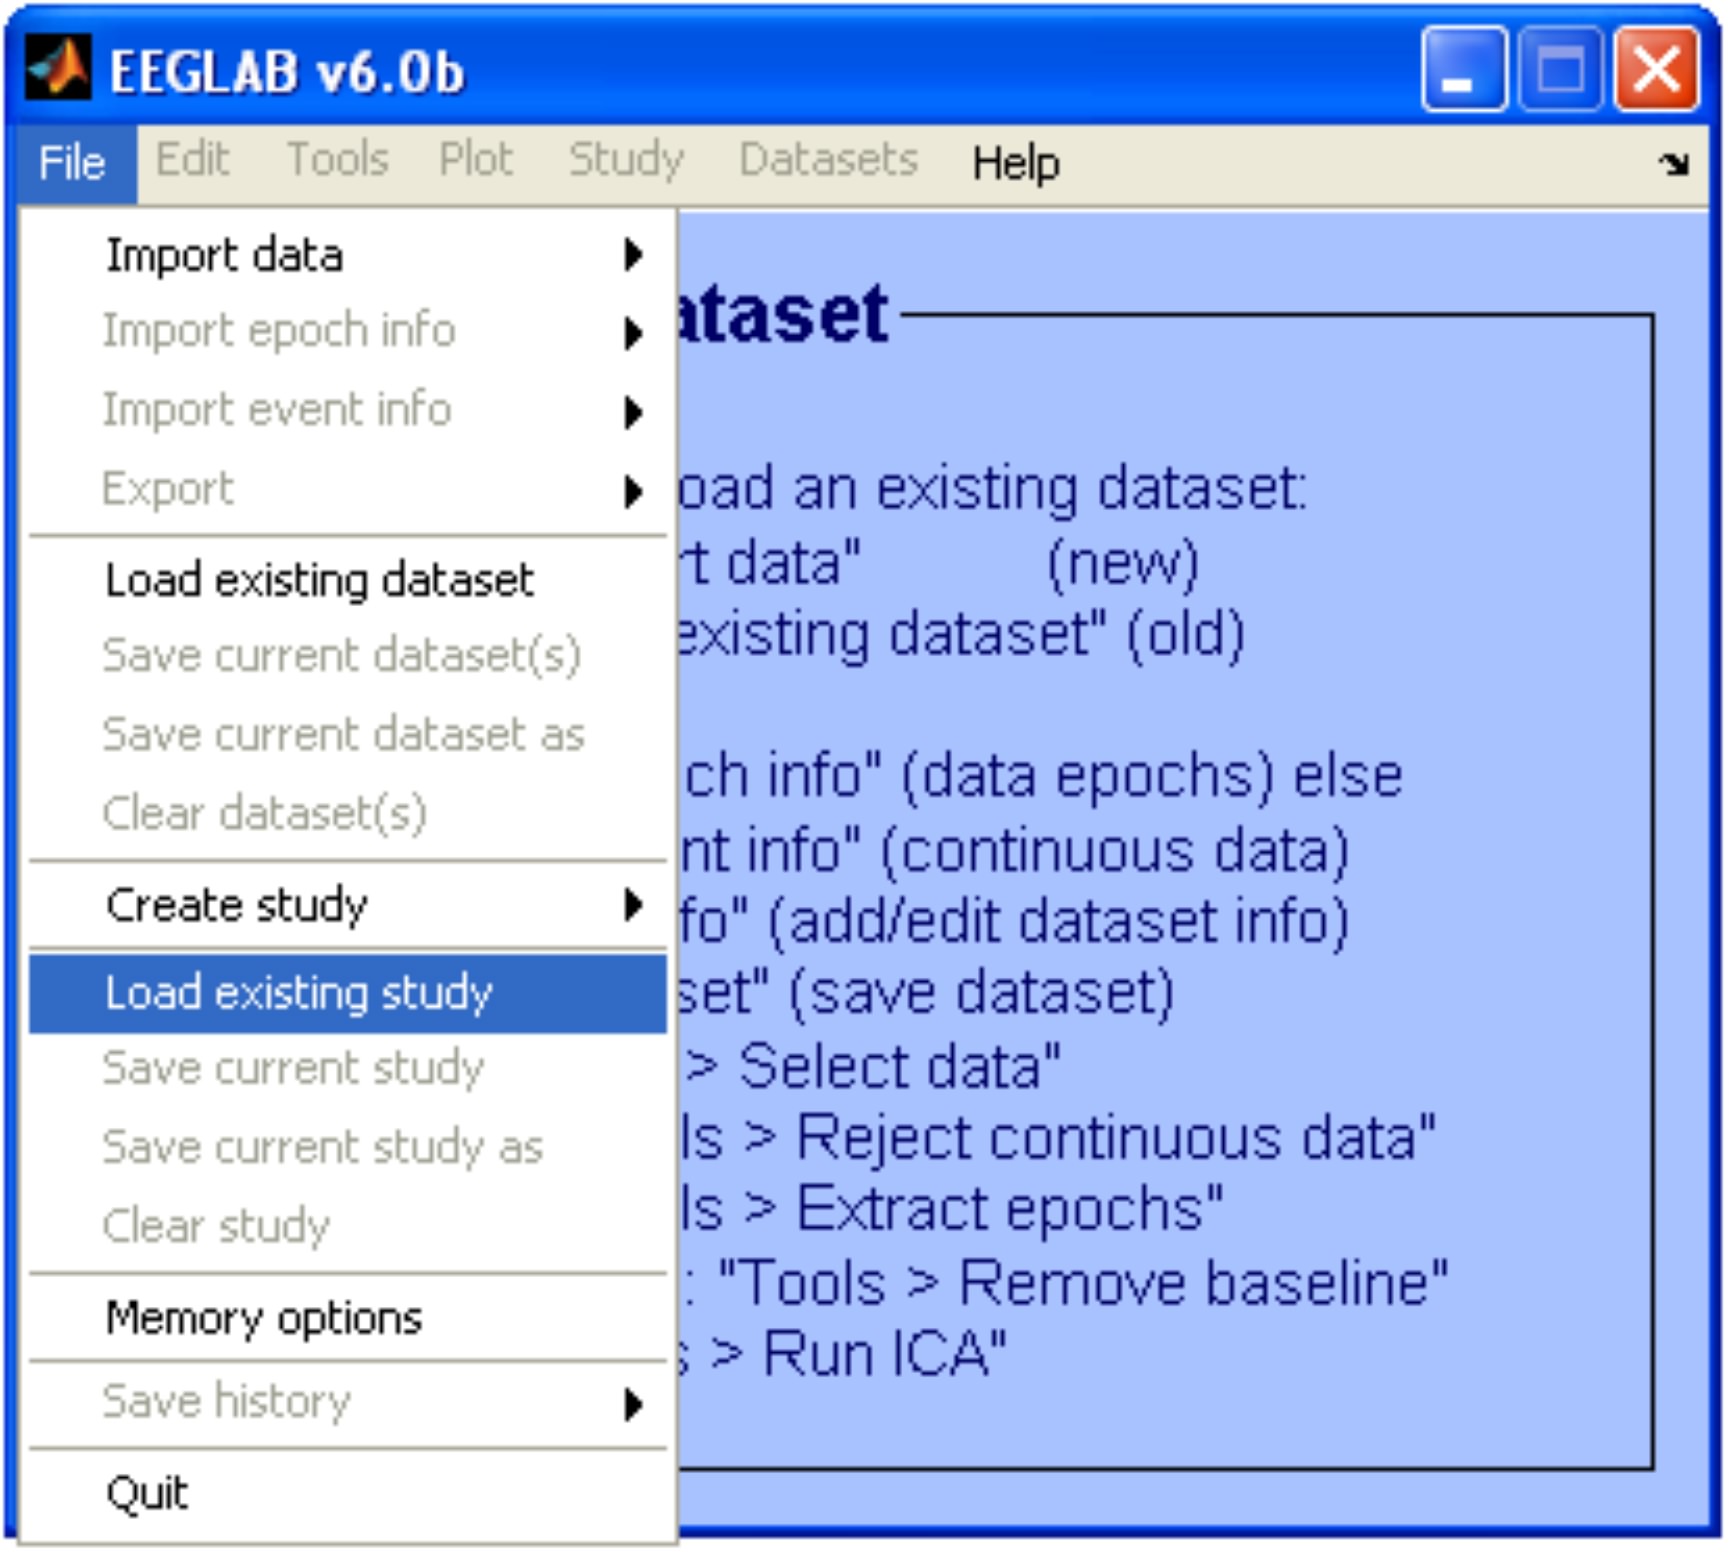
1) Loading a STUDY set
Load a study set (File > Load existing study).
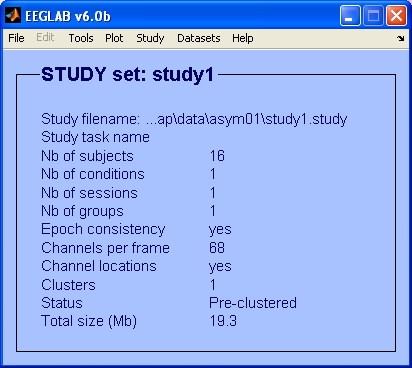
In our example the study set is called: 'study1.study'. It is constituted by 16 datasets with 68 channels each.
2) Choosing a template
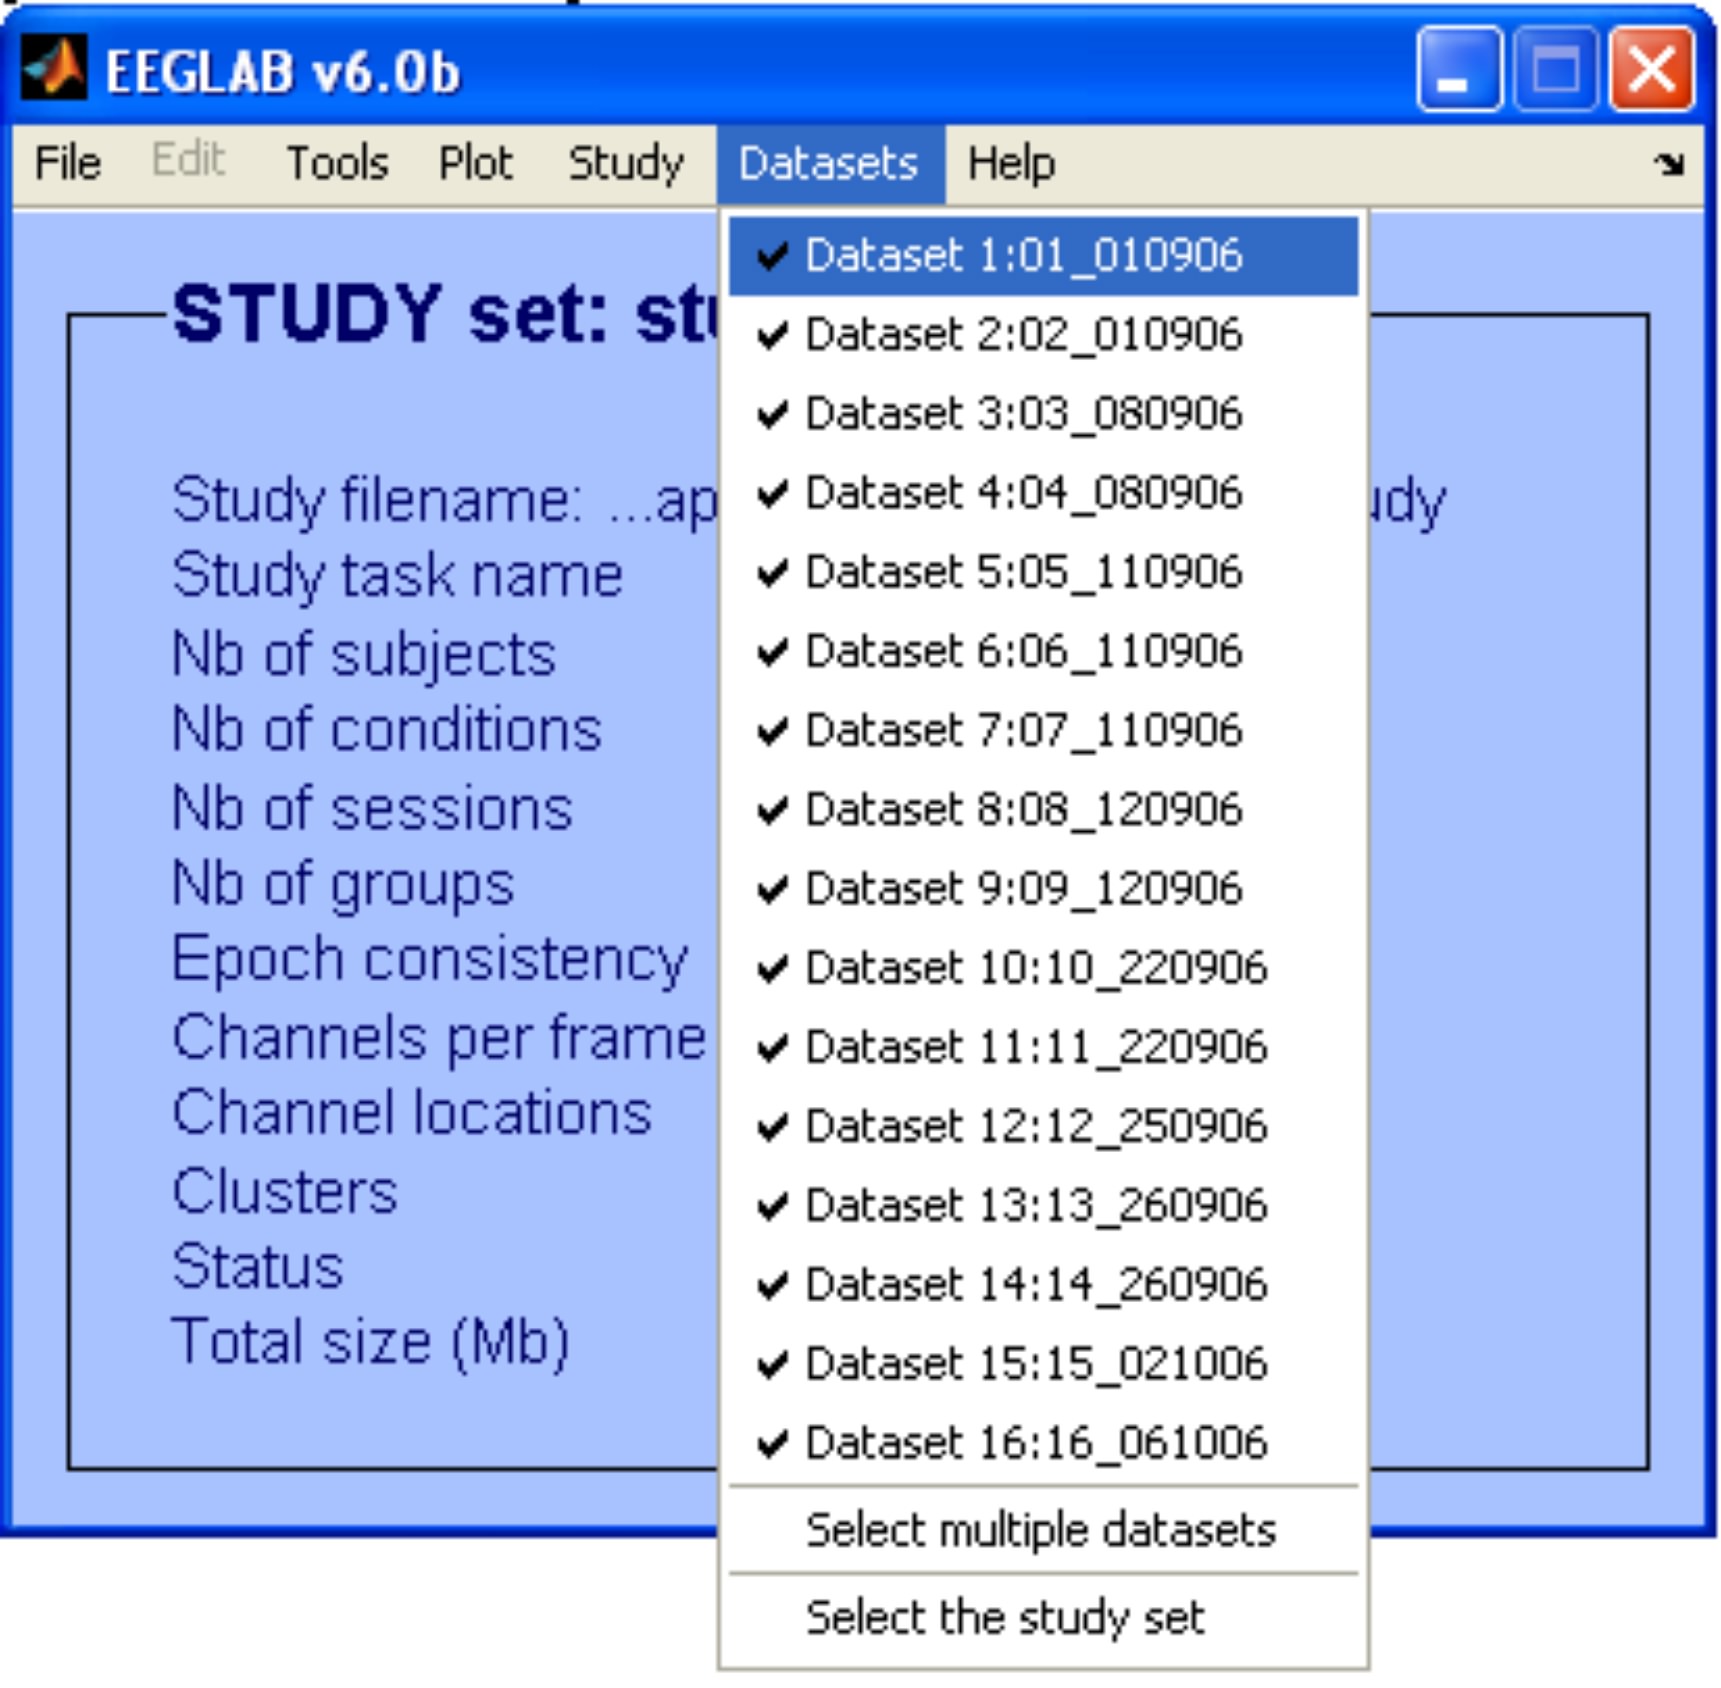
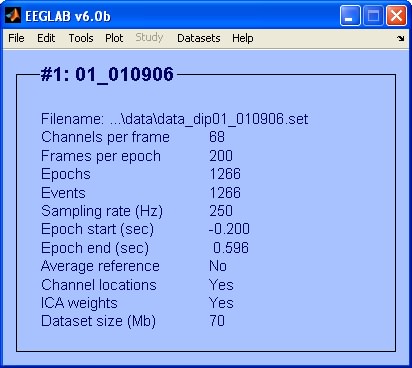
Before using CORRMAP, we need to choose an IC template. In order to do that, we choose one of the datasets (e.g. dataset 1) using the menu item Datasets.
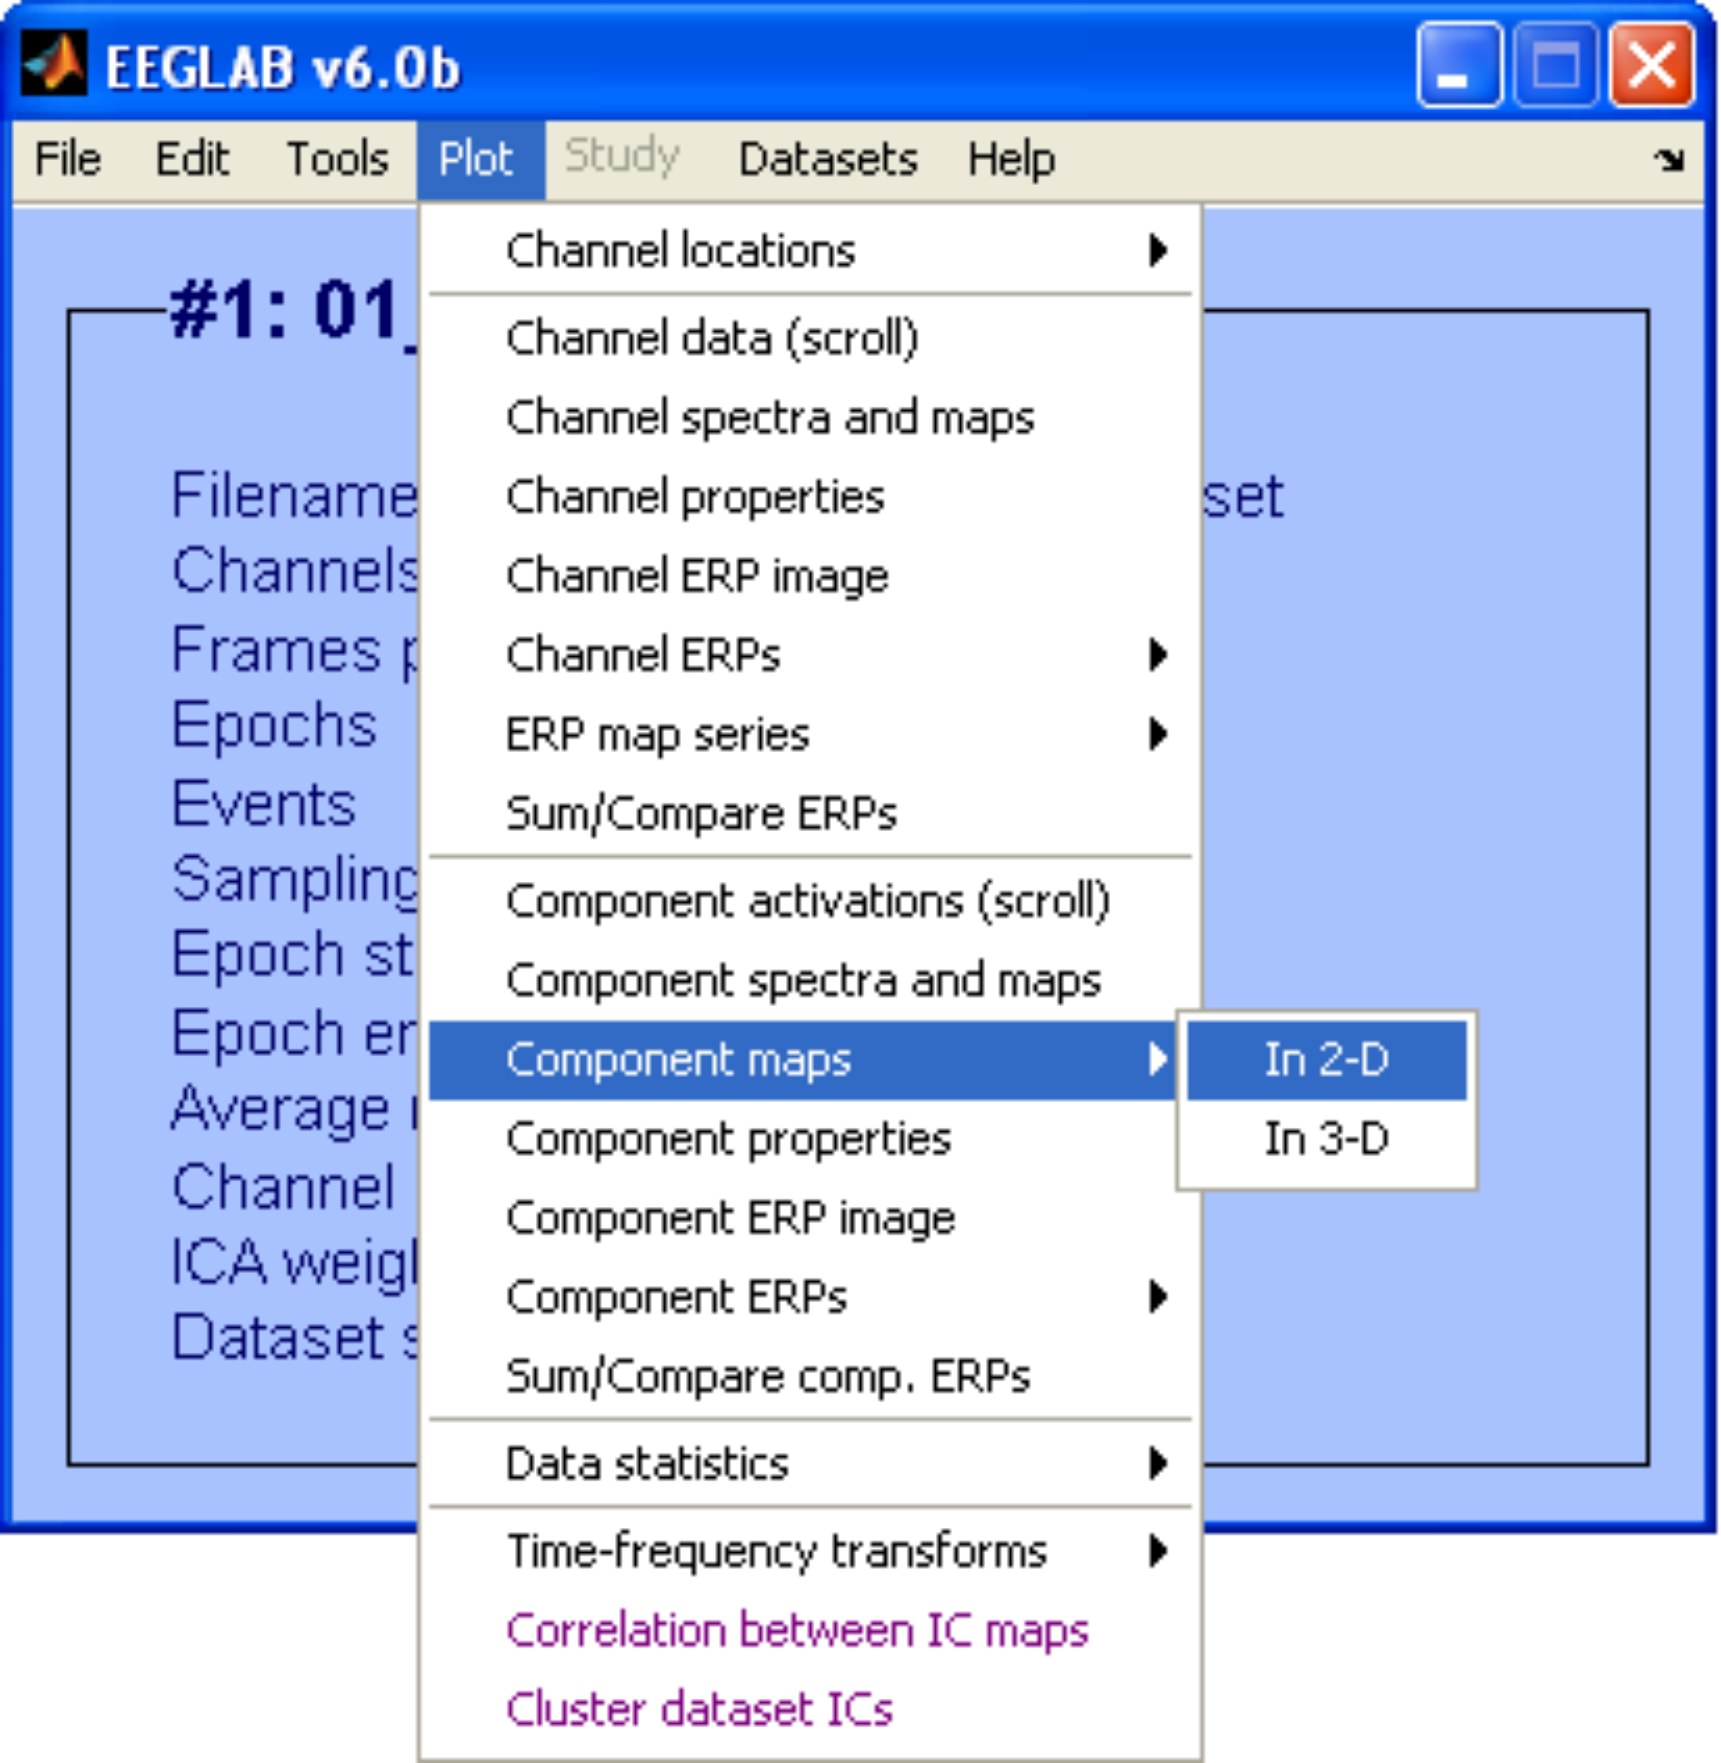
To inspect topographical maps of the ICs we use the menu item Plot > Component maps > In 2-D. In this example we are going to plot only the first 30 ICs.
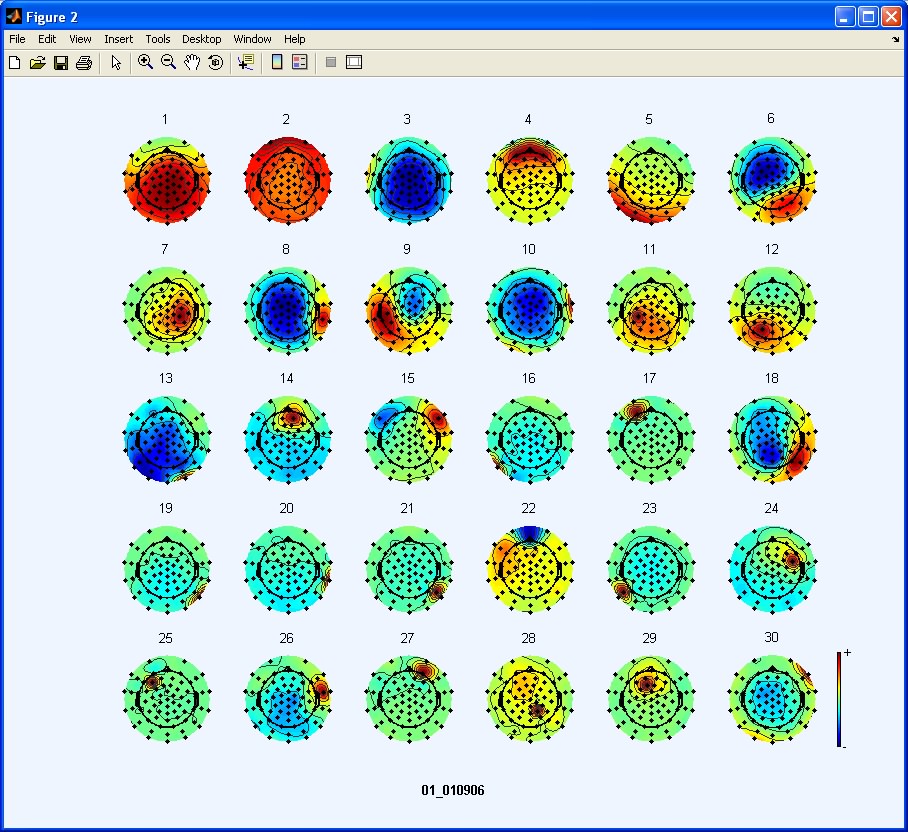
Exploratory Step: After inspecting the data we choose IC 4 as a good representative of an eye blink artifact.
3) Editing input parameters
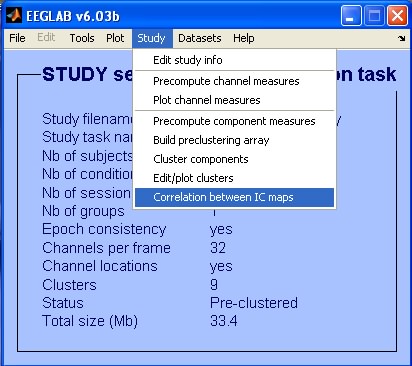
After choosing the template, we go back to the study ( Datasets > Select the study set) and open CORRMAP (Plot > Correlation between IC Maps).
The following menu is displayed.
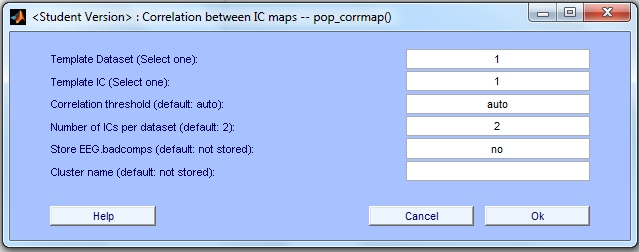
There are six parameters that can be changed by the user. The first five parameters (Template Dataset, Template IC, Correlation Threshold, Number of ICs and Store EEG.badcomps) are mandatory, which is why there is default information in the applicable boxes. Before showing how to run CORRMAP using the template selected above, we briefly describe the input parameters.
Mandatory parameters (cannot be left blank):
Template Dataset: index of the dataset containing the template IC. Must be an integer between 1 and the number of datasets. In this example set index=1.
Template IC: index of the template IC. Must be an integer between 1 and the maximum number of ICs in the choosen dataset. In this example, IC index=4. CORRMAP can operate with datasets containing a different number of ICs.
Correlation Threshold: can be set to 'auto' or to a positive numeric value bigger than 0 and smaller than 1. By default CORRMAP uses threshold='auto'.
Note that the output displayed depends on the correlation threshold option that you choose.
- 'auto' one output plot displayed (only last iteration).
- 'numeric value' two output plots displayed (both iterations).
Number of ICs: maximum number of ICs above threshold that will be selected from each dataset. We recommend the default value to be 2 however this can be changed by the user. For more details see >>help corrmap or CORRMAP reference paper [1].
Bad Components: the indices of all ICs found by CORRMAP can be saved in the EEG structure in a field called EEG.badcomps when this parameter is set to yes (by default ICs indices are not saved in the EEG structure badcomps=no). To learn more about this option check FAQs.
Optional parameters (can be left blank):
Cluster name: name that will be assigned to the new cluster containing the selected ICs. The cluster name it is also used to rename the updated study that is then saved in the same location as the study that is being processed. If left blank, no information is saved.
4) Running CORRMAP using the eye blink template
In the CORRMAP menu we insert the following information for the five mandatory parameters.
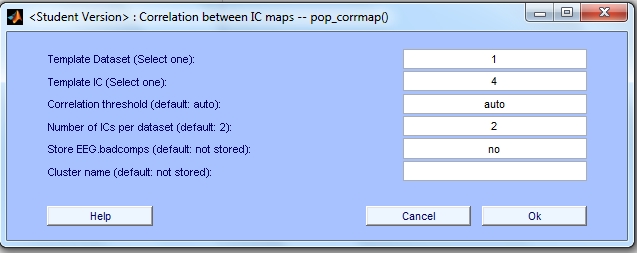
The other optional parameters are intentionally left blank. After entering the values for the parameters, we press 'OK'.
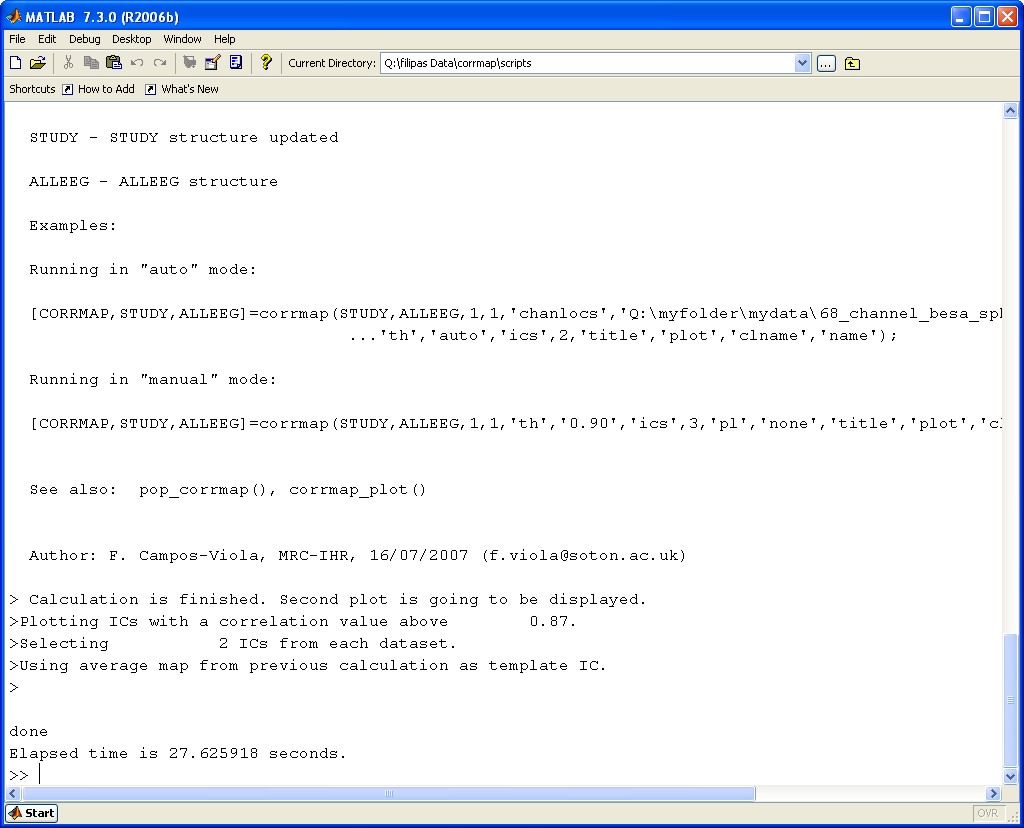
While CORRMAP is processing the data, a number of info messages are displayed in the command line. Here is an example:
After processing a window with the output plot is displayed. The output plot corresponds to the last iteration performed by CORRMAP and it consists of 5 sections:
1) Info Table; 2) Average Map; 3) Correlation Plot; 4) Threshold Plot ; 5) Clustered ICs.
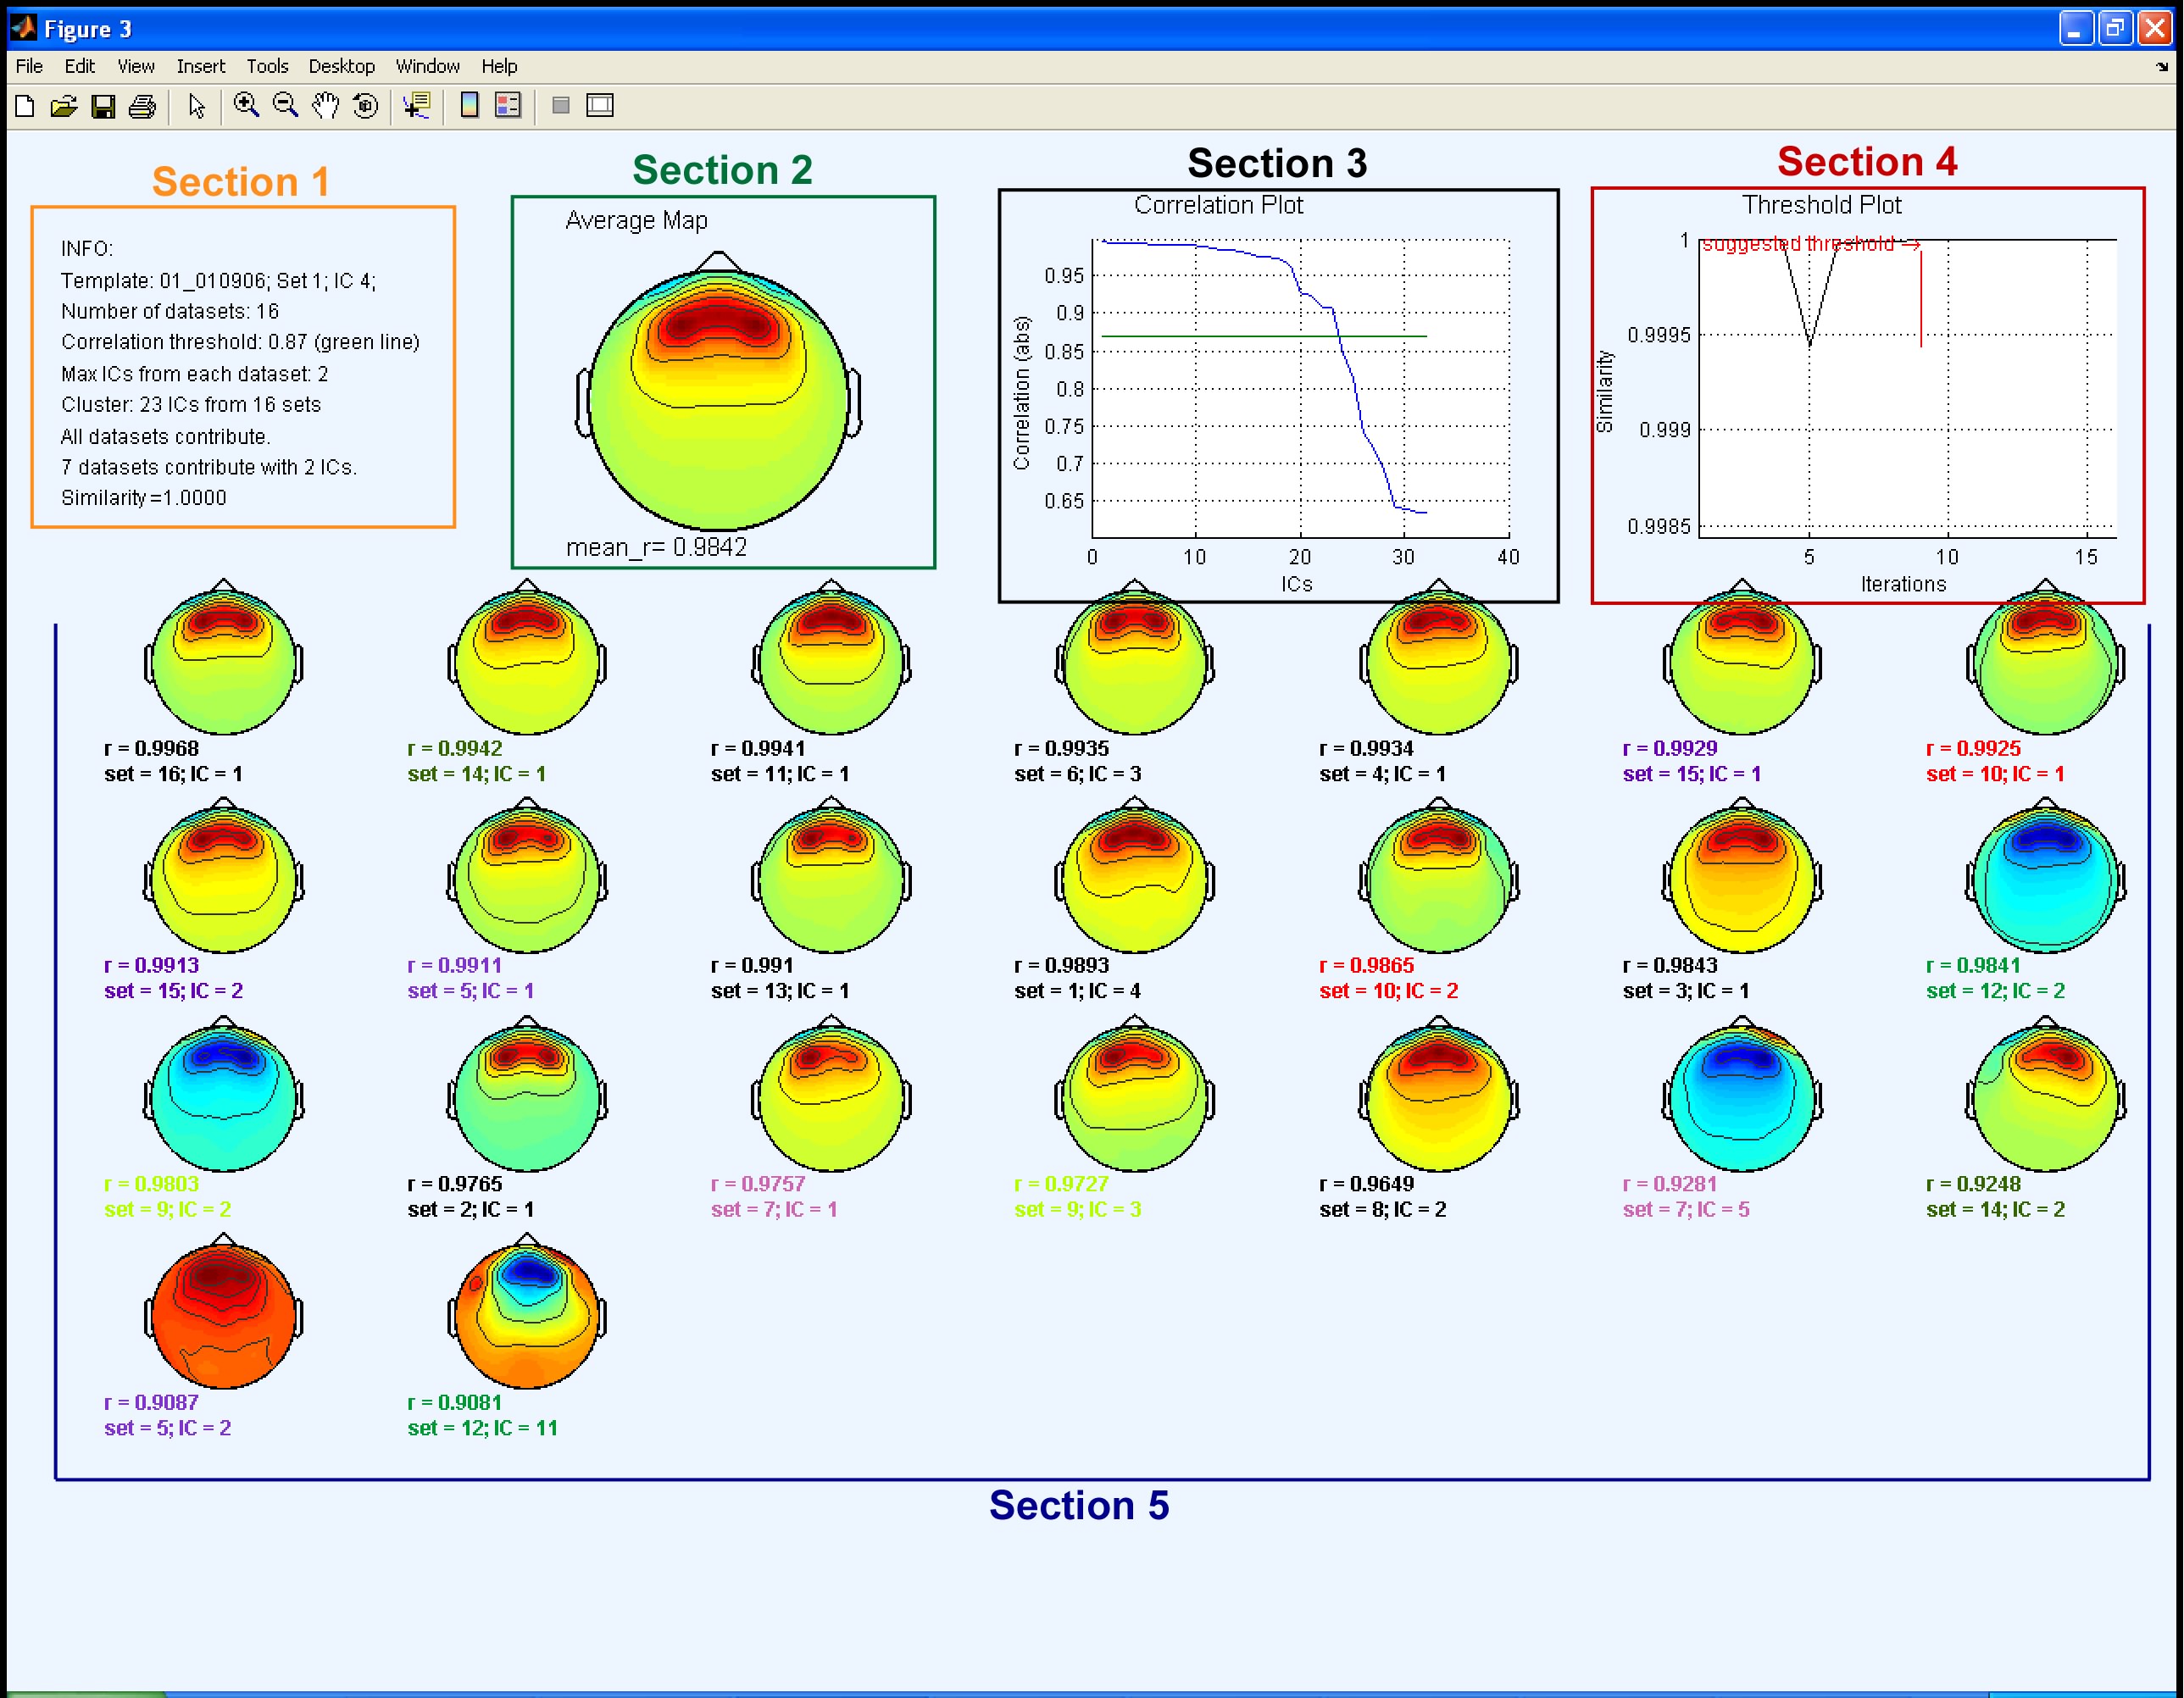
1) Info Table contains the following information:
- Name and indices of template IC (input parameters);
- Number of datasets evaluated (all datasets stored in the STUDY are evaluated);
- Correlation threshold (in this example the suggested value calculated by CORRMAP);
- Number of ICs selected from each dataset (input parameter);
- Number of ICs belonging to the cluster (output);
- List of datasets that do not contribute to the cluster (output);
- Number of datasets that contribute two ICs (output);
- Similarity index (output);
2) Average Map The average map is calculated using information from the maps of the clustered ICs (section 5). Before averaging, each map is normalized (RMS normalization) and the maps from the ICs that have a negative correlation value above the threshold are inverted. The mean correlation value (mean_r) is also displayed.
3) Correlation Plot X axis: ICs; Y axis: absolute correlation value. Blue line represents the correlation distribution for the 32 ICs selected (2 ICs × 16 datasets). Green line represents the threshold value: in this case, the one suggested by CORRMAP (r=0.87).
Note that the number of ICs belonging to the cluster, in this case 23, is lower than the total number of ICs selected (32), since only the ones above the correlation threshold are clustered.
4) Threshold Plot X axis: number of iterations (fixed value); Y axis: similarity index. The black line represents the similarity index calculated in each each iteration. The red line represents the suggested threshold that corresponds to the iteration when the similarity index has its maximum value. Each iteration is associated with a threshold value.
5) Clustered ICs Each plot represents the topographical map for an IC with a correlation value above the threshold. The plots are labelled with Set index, IC index and absolute correlation value. When the maximum number of selected ICs is two, ICs belonging to the same dataset are labelled with the same colour. In this example there are 7 datasets contributing two ICs, so there are 7 different colours in the legends.
This concludes the tutorial. If you would like to learn more about other CORRMAP features, please read CORRMAP paper [1] or check FAQs.
FAQs - Frequently Asked Questions
You can find a list of FAQs here.
This is a free software distributed under the GPL. However, the authors do ask those that find this program of use to cite it in their work refering to [1]. Also, please make sure that EEGLAB is cited properly as described in the EEGLAB website.
The CORRMAP plug-in functions, sources and programs are released under the terms of the GPL.
CORRMAP plug-in is distributed "AS IS" under this Licence in the hope that it will be useful. The authors make clear that no condition is made or to be implied, nor is any warranty given or to be implied, as to the accuracy of the Software, or that it will be suitable for any particular purpose or for use under any specific conditions. Furthermore, the authors disclaim all responsibility for the use
which is made of the Software. They further disclaim any liability for the outcomes arising from using the Software.
By downloading or making this software available to others you agree to the terms of this licence and agree to let these terms known to other parties to whom you make this software available.
[1] Viola FC, et al. Semi-automatic identification of independent components representing EEG artifact. Clin Neurophysiol 2009, May; 120(5): 868-77.
This work was partially supported by Fundacao para a Ciencia e Tecnologia, Lisbon, Portugal (SFRH/BD/37662/2007) to Filipa Campos Viola. Major technical advises were provided by Stefan Debener and Jeremy Thorne. Testing and advises throughout were also provided by Lars Tjelta Westlye. Also, thanks to Arnaud Delorme for his valuable comments and suggestions and to Jan Wessel for reporting bugs and providing advice how to fix them.
This page was last updated May 20, 2011.