FAQs - Running CORRMAP and saving ICs in a cluster
In this example we are going to use the same STUDY set used in the Tutorial ('study1.study'). This time we choose a lateral eye movement template (IC 15 from dataset 1) and we set the threshold to '0.9'. We are also going to choose a cluster name ('lem').In the CORRMAP menu we insert the following information for all parameters.
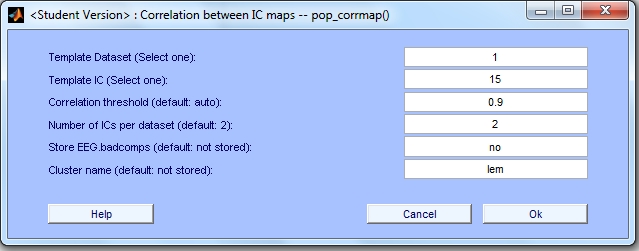
After entering the values for the parameters, we press 'OK'.
Disclaimer: If you have forgotten to pre-cluster your STUDY, the following error message will be displayed.
Error: STUDY is not pre-clustered. If you want to save CORRMAP cluster, please pre-cluster the STUDY.
see >> help corrmap.
Please check FAQ number 2.
After processing, two windows with the output plots are displayed. The first plot corresponds to the first iteration and the second corresponds to the second iteration. Both plots consist of 4 sections: 1) Info Table; 2) Template Map + Average Map; 3) Correlation Plot; 4) Clustered ICs.
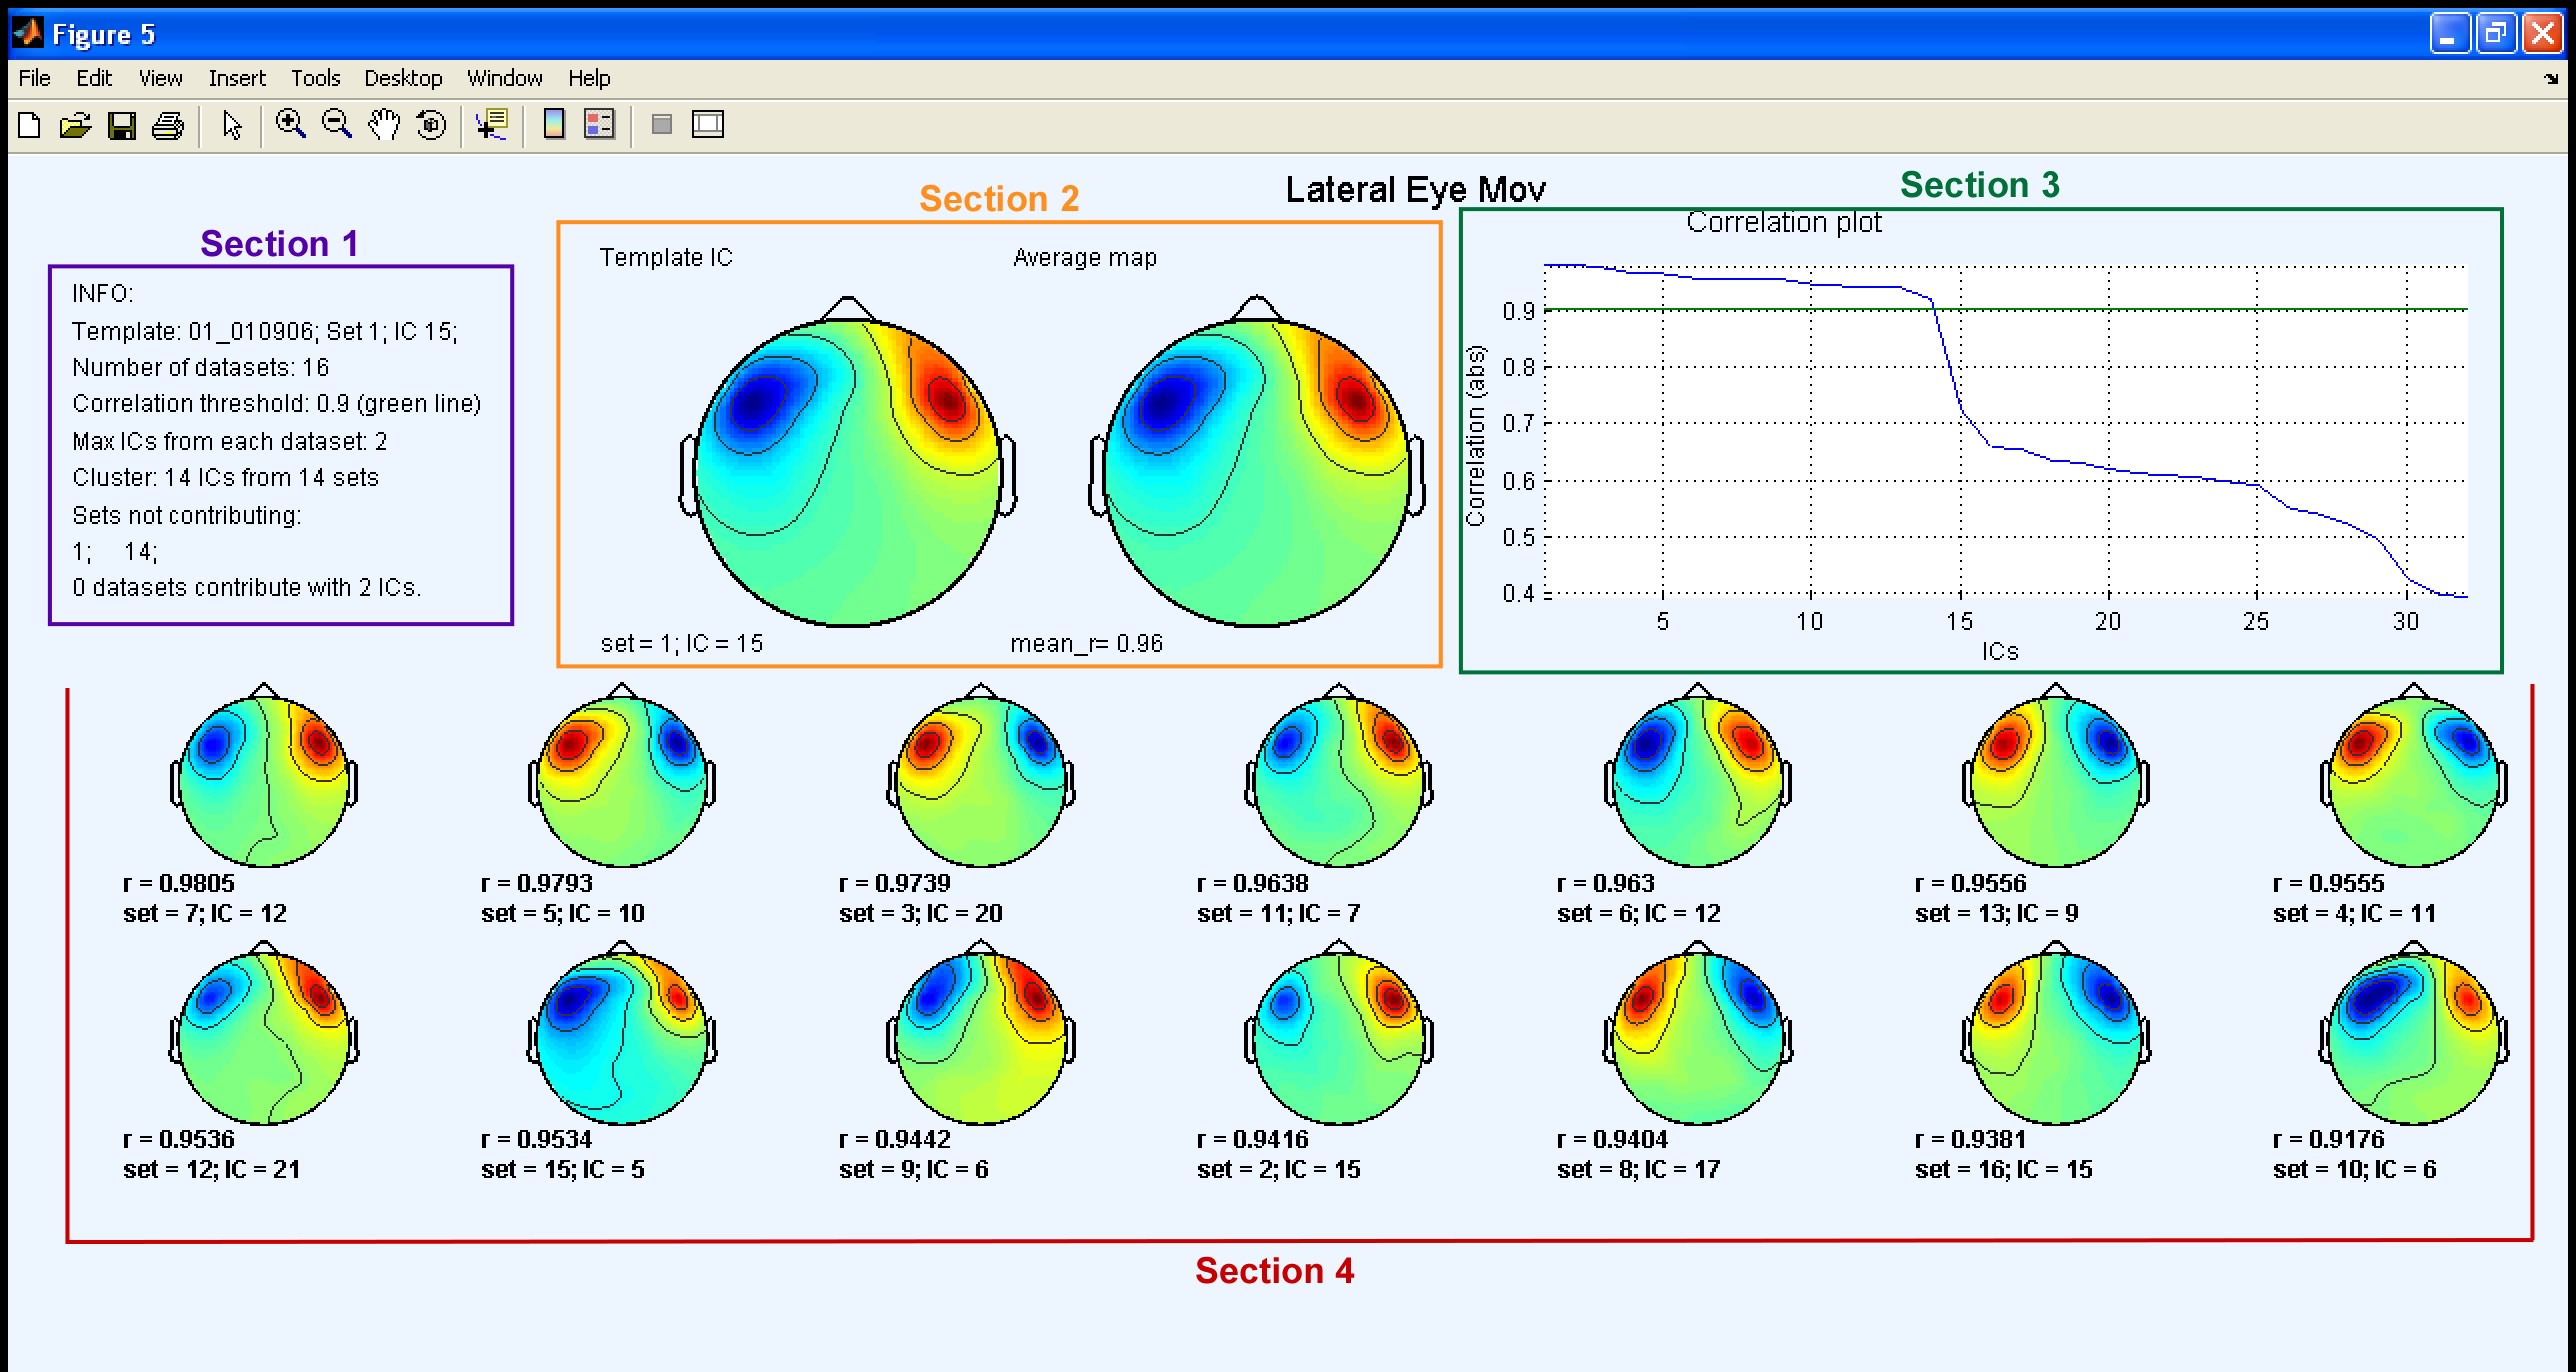
Sections 1 and 3 and 4 contain the same features described before in the Tutorial. Note that the threshold plot is not displayed in any of the output plots since in this example the input parameter correlation threshold was set to a numerical value chosen by the user. When this option is set the main difference is that two output plots are displayed. The first output plot shows both the template map and the average map (section 2) calculated as in the Tutorial. In the second output plot (shown below), the average map from the first iteration is used as a template and a new average map is calculated. Only the new average map is displayed in section 2.
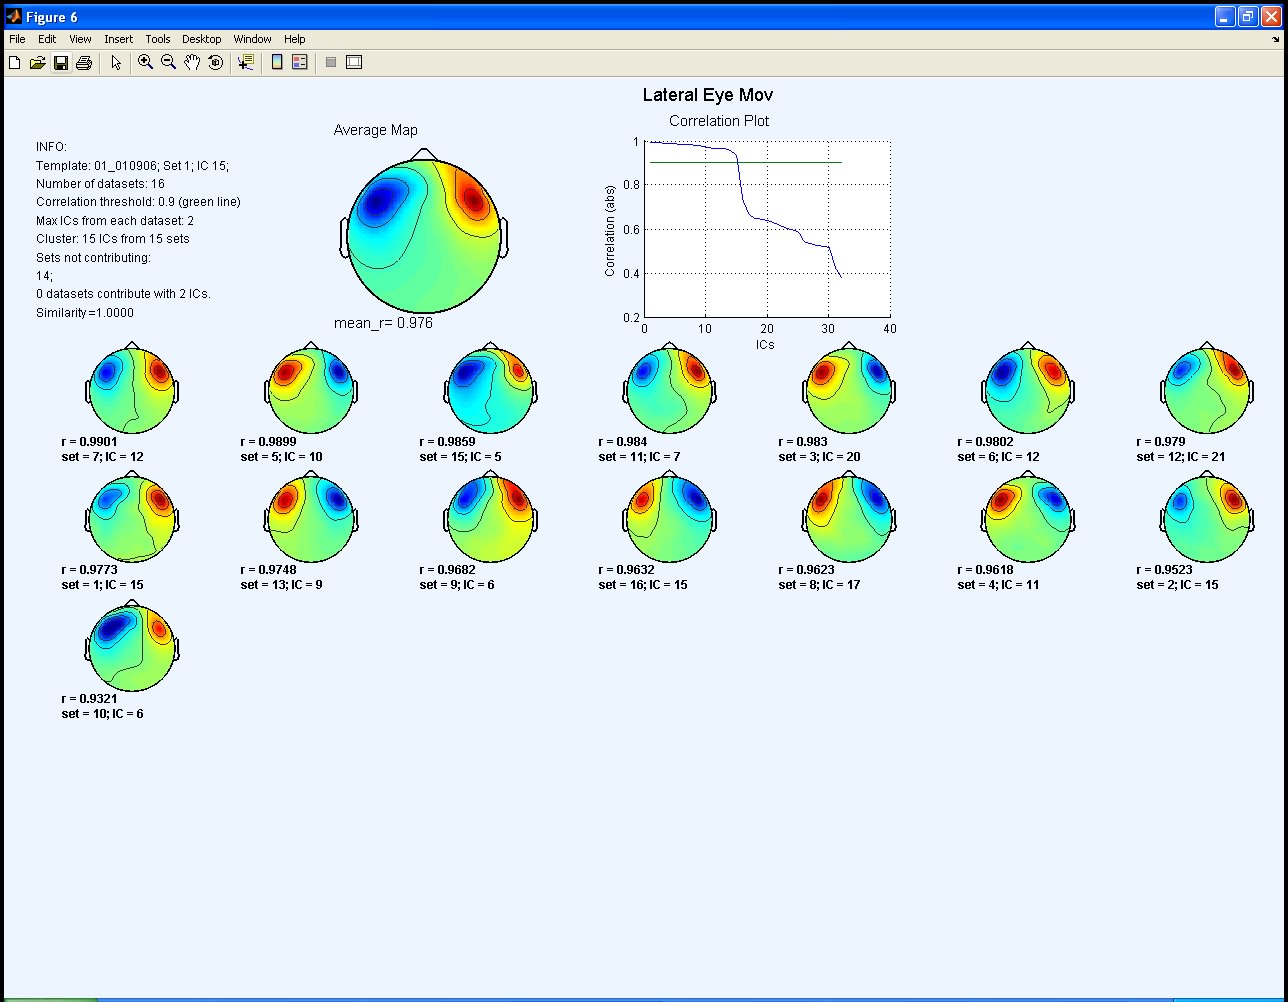
As you can see, in the second output plot there is an additional IC map in the cluster. This in fact corresponds to the original template IC (IC 15 from set 1), since in this iteration the template is now the average map from the previous iteration, and not the original template. Note that in neither output plot is there any dataset contributing more than a single IC to the cluster. All labels for the clustered ICs therefore have the same default colour (black).
When you analyse your data it might be very useful to compare both output plots. If you originally selected an unsuitable IC as your initial template, then of course Corrmap may identify inappropriate ICs as belonging to the cluster. In this case, the average map calculated in the first iteration will also be unreliable. Inspection of both plots should help to avoid this possibility.
Note that in this example the cluster name was set to a string, therefore an updated study was saved in the same location as the 'study1.study' with the name provided ('lem.study') as shown below.

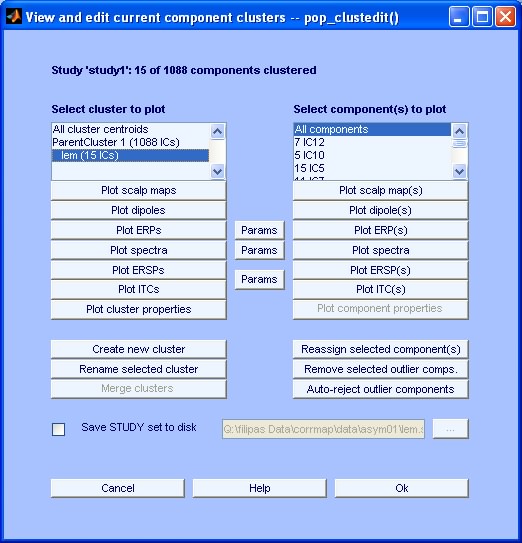
If you want you can load the new study 'lem.study' and edit/explore it using the EEGLAB available tools in the menu Study. Note that the number of clusters in the main window changed from 1 to 2.
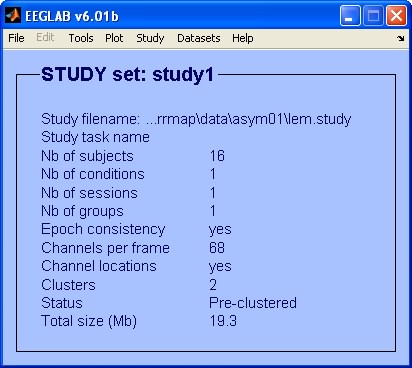
Disclaimer: The Status is not changed from 'Pre-clustered' to 'Clustered using CORRMAP' because that would require changing other EEGLAB functions.
Exploratory Step: Select menu item Study > Edit plot clusters. Inspect the different properties of the new cluster using the available plotting options (see below). Note that you had to select the different parameters in the pre-clustering step in order to be able to visualize the correspondent plots. For more information refer to EEGLAB tutorial: Independent Component Clustering.
This page was last updated May 20, 2011.